Foster Care Supply & Demand Explorer
I joined this project the day after an 8-hour workshop I hadn’t attended — with a transcript, five SMEs I’d never met, and a deadline to produce validated product requirements. This is how I used AI to build research context from zero, and why the hardest decisions had nothing to do with the interface.
Every SME I interviewed described the same crisis: children sleeping in state offices and hotels because no licensed foster home existed for them. The federal government set a goal of a 1:1 ratio of foster homes to children in care. The tools recruiters were using to close that gap? Old Excel files and billboard campaigns with no ability to target who to recruit, or where.
The initial ask was to help design a Supply & Demand Explorer that would help state agencies identify where foster homes were needed most and target the right families with precision — fast enough to support a pre-sales prototype.
The domain was deeply specialized, politically sensitive, and ethically loaded. SMEs were spread across states, roles, and policy contexts. Sessions were 2–3 hours each and raw. I needed to move from unstructured expert knowledge to structured design requirements — that’s where AI tools became essential.
For the child welfare system, the gap between children in care and available foster homes is not an abstraction. Children sleep in state offices and hotel rooms when placements cannot be found. The federal government has set a 1:1 goal. The tools recruiters were using to close that gap — old Excel files, billboard campaigns — had no ability to target who to recruit, or where.
A six-month engagement. A team of four. The scope reflected what leadership already understood: this wasn’t a cosmetic problem, and a fast fix wasn’t going to move the number.
I led UX research on a four-person Deloitte team — responsible for designing, facilitating, and synthesizing across all six research phases. The engagement ran six months. Research and strategy occupied the first half; design specification and iteration the second.
This project stands apart from most of my Deloitte work in one important way: the primary research subjects weren’t enterprise users in a workshop. They were frontline state workers and policy leads describing a system under genuine stress — children without homes, recruiters without tools.
Why it was hard — and why I was starting from zero. The domain was deeply specialized, politically sensitive, and ethically loaded. SMEs were spread across states, roles, and policy contexts. Sessions were 2–3 hours each and raw. But the harder constraint was personal: I missed the original 8-hour Industry Advantage Lab entirely. I joined this project after the workshop had already run — which meant I had no firsthand context, no relationship with the SMEs, and no instinct for what had landed in the room. Every other researcher on the team had been there. I hadn’t. Getting up to speed fast enough to be useful wasn’t a preference — it was the condition I was working under. That’s where AI tools stopped being optional.
I didn’t use AI as a single catch-all. I made deliberate choices about which tool to use when, and why — matching each tool’s strengths to the specific research need at each phase. The result was a process where each stage fed directly into the next.
“This was a five-person research team — one designer per Industry Lab, all running in parallel. I was responsible for the child welfare lab. I missed the full-day kickoff workshop. The process below is how I rebuilt context from zero and produced validated research findings in time to matter.”
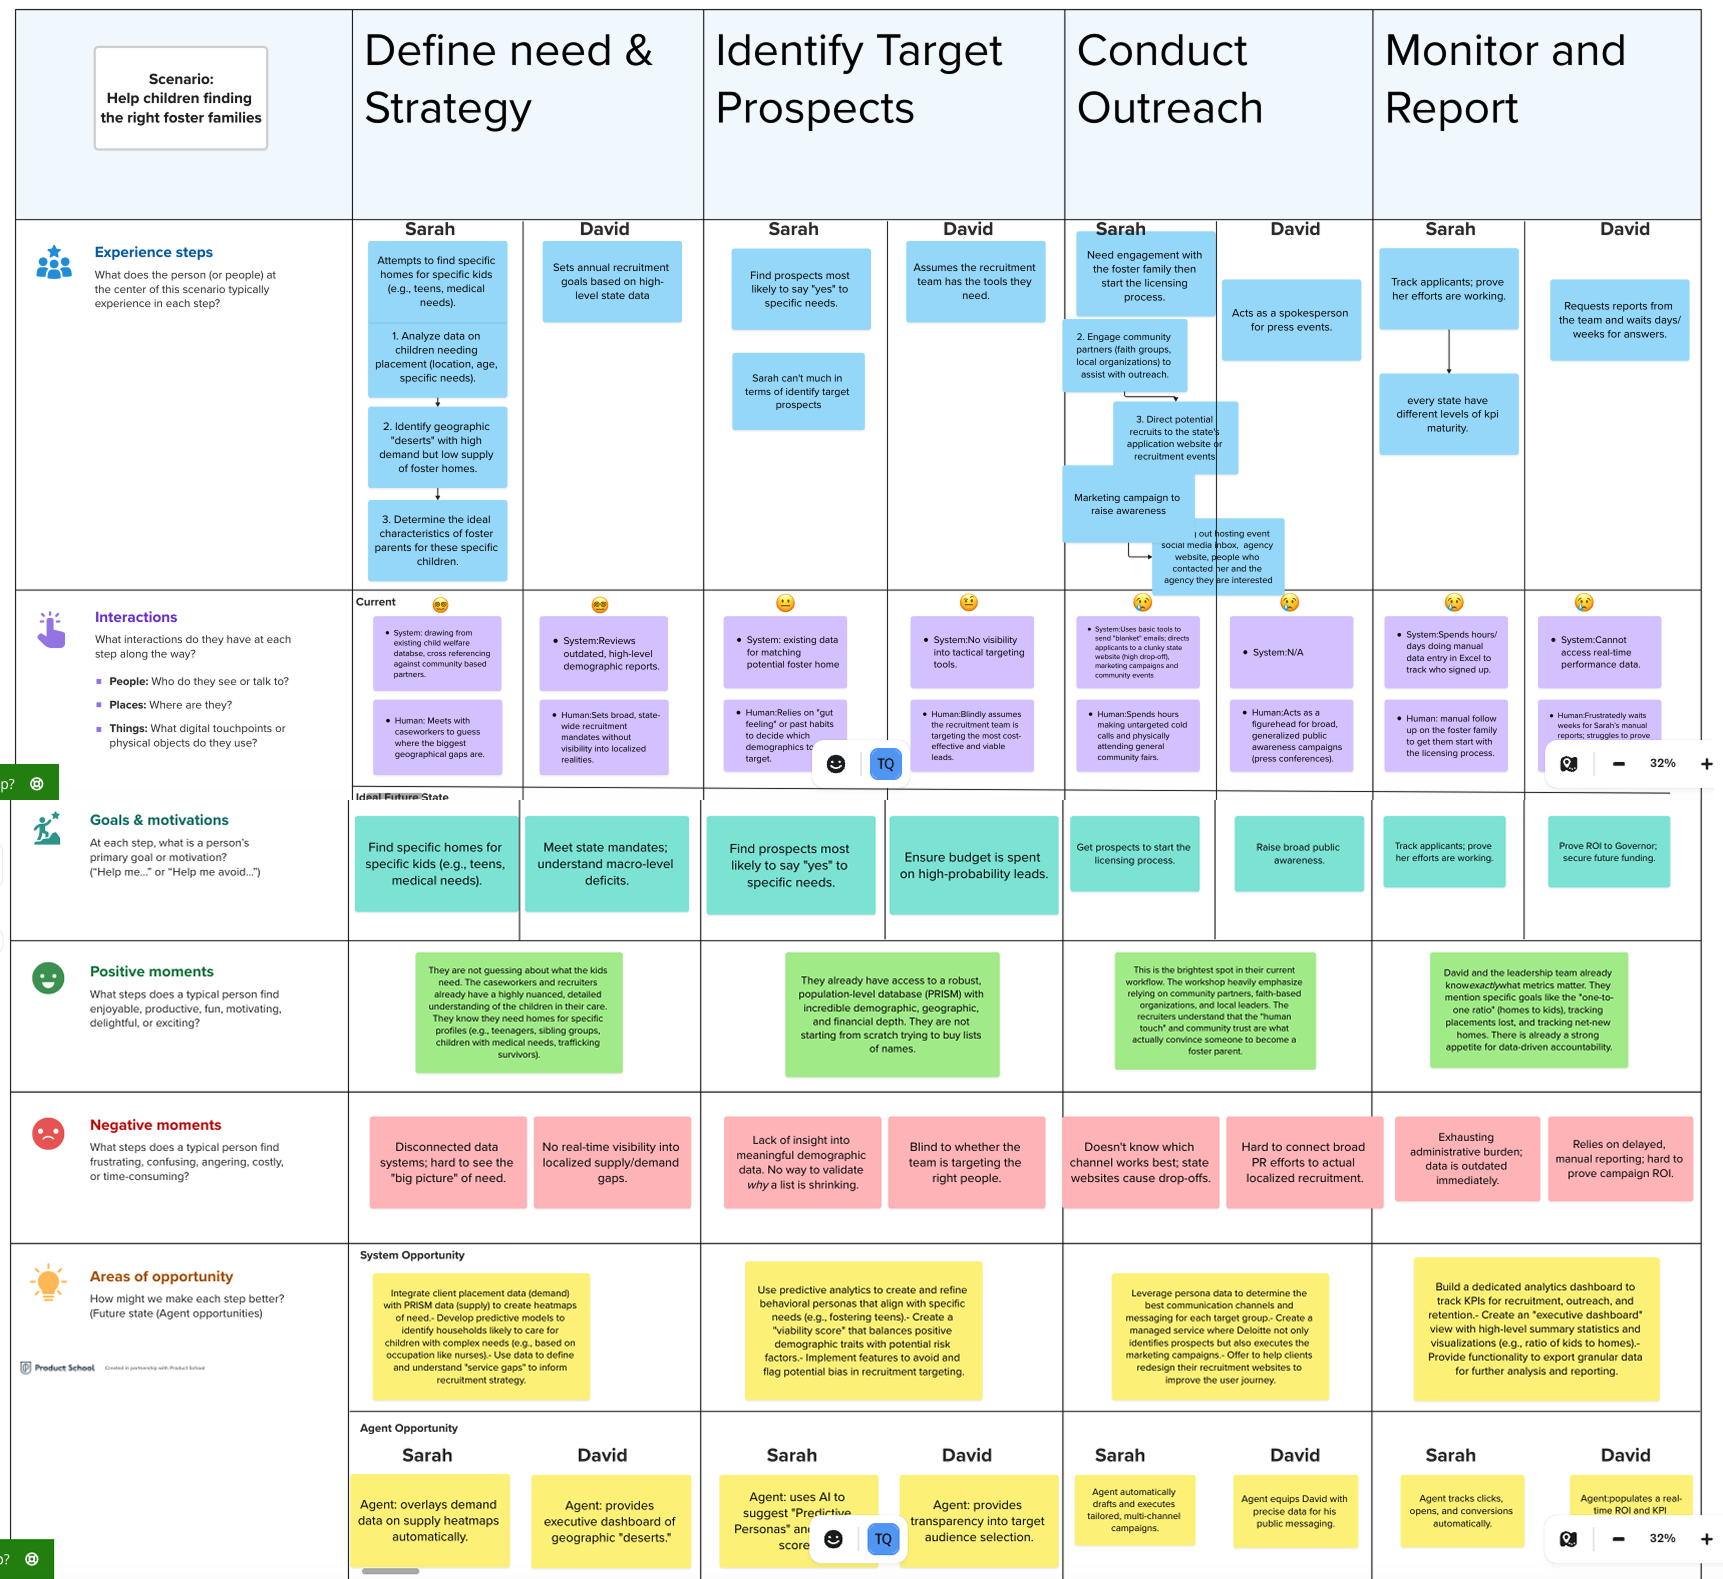 Mural board — journey map built from Gemini output, interrogated for gaps
Phase 1 was a full-day structured workshop with 10+ child welfare policy leads, Deloitte practitioners, and data scientists. Five activities ran in sequence: friction mapping, five W’s persona work, “how might we” brainstorming, dashboard improvement ideation, and feature prioritization voting. All output captured in Mural. Zoom recorded the full session.
Phases 2–3: With no firsthand presence in the lab, a transcript was all I had. I fed the full 8-hour workshop recording into Gemini and treated it as a working session — not a one-shot prompt, but a conversation. I asked it to synthesize what the room had surfaced, then pushed it iteratively: first for two draft user personas, then for a user journey map and empathy map. The goal wasn’t to accept the AI output — it was to get something concrete enough to interrogate. I transferred those outputs into Mural alongside the raw transcript data, mapped everything spatially, and used what I found to identify what was still unclear, contradicted, or unvalidated. That became the input for the follow-up interview guide.
Phase 4: Using the Mural map as context, I asked Gemini to generate a structured follow-up interview guide targeting questions the lab hadn’t answered and gaps in the journey map that were still ambiguous. The guide gave each follow-up interview a tight, purposeful structure.
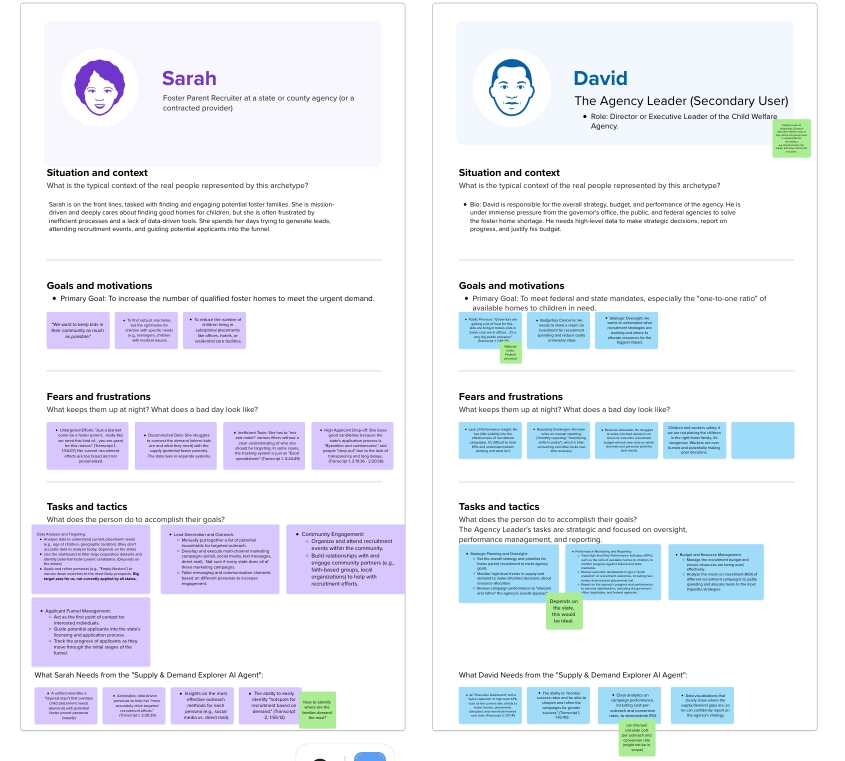
Phase 5: I conducted five focused follow-up interviews with individual SMEs. Notes were captured directly in Mural alongside existing personas and journey maps. The goal: validate, challenge, and deepen what the lab and Gemini synthesis had surfaced — especially around AI ethics, user identity, and data constraints.
Phase 6: I brought everything together into Claude at once — all lab transcripts, all five follow-up transcripts, the Gemini-generated personas, journey map, and Mural interview notes. I asked Claude for a complete synthesis: updated personas, journey map, key pain points, solution trees, and a prioritized feature list for the PRISM team.
Finally, I collaborated with designers from other Industry Labs to run a cross-team affinity mapping session across all SME outputs. This cross-lab exercise identified the most broadly demanded features — validating that our synthesis wasn’t just locally relevant but aligned with what other child welfare SMEs were calling for.
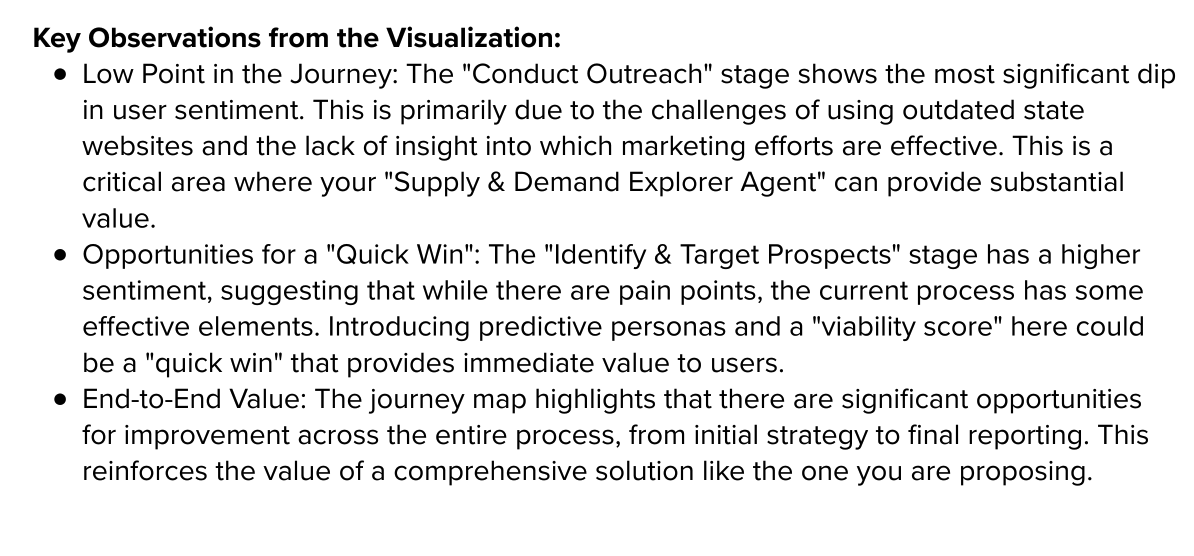 Industry Advantage Lab — key themes surfaced from the full-day workshop
My AI strategy wasn’t “use one tool for everything.” Each tool played a distinct role at a specific phase — and the handoff between them was intentional. Here’s how and why.
Gemini came first — not as a preference but as a necessity. Having missed the 8-hour Industry Advantage Lab entirely, a transcript was my only way in. I fed the workshop recording into Gemini and worked through it conversationally — asking it to synthesize the session, then iterating: first for two user personas, then for a user journey map and empathy map. After mapping those outputs in Mural and identifying what was still unclear, I asked Gemini to generate a structured follow-up interview guide built specifically around the questions the lab hadn’t answered and the gaps in the journey map I couldn’t resolve from the transcript alone. Working from a transcript without room presence turned out to be instructive. I couldn’t fill gaps from memory or instinct — everything had to come from what was actually said. That constraint forced more precise prompting than I would have done otherwise, and it made the gaps more visible, not less. Its conversational format was well-suited to early exploration — where I needed to move fast, test framings, and build a foundation I could hand off to the follow-up interviews. The goal was never to trust the output. It was to have something concrete enough to challenge.
Claude handled final synthesis, after all five follow-up interviews were complete. I brought everything in at once: all lab transcripts, all five follow-up transcripts, the Gemini-generated personas and journey map, and the Mural interview notes. With a larger context window and stronger cross-source pattern recognition, Claude could hold the full research corpus at once and identify contradictions, convergences, and priorities I couldn’t have found by reading each source separately.
Mural served as the connective tissue across three distinct phases. During the lab, it was the collaborative workspace for all five structured activities. After Gemini synthesis, I transferred the AI-generated outputs into Mural to visualize and interrogate what was unclear. During the follow-up interviews, I captured all SME notes directly in Mural alongside the existing maps — keeping all research artifacts in one shared visual space that I could hand off to other designers and feed back into Claude as structured context.
Cross-team affinity mapping was the final validation layer. After Claude’s synthesis, I collaborated with designers from other Industry Lab tracks to compare findings across all five labs. When pain points and feature needs converged independently across multiple labs, they moved to the top of the PRISM product priority list — a level of validation no single AI synthesis could have produced on its own.
 Mural board — SME follow-up interview notes captured alongside existing maps
A critical finding from the lab was that the primary user wasn’t settled. The tool could serve either a state agency recruiter directly, or a Deloitte practitioner operating as a managed service. That decision changed almost everything downstream — data access, output format, liability, and interface complexity.
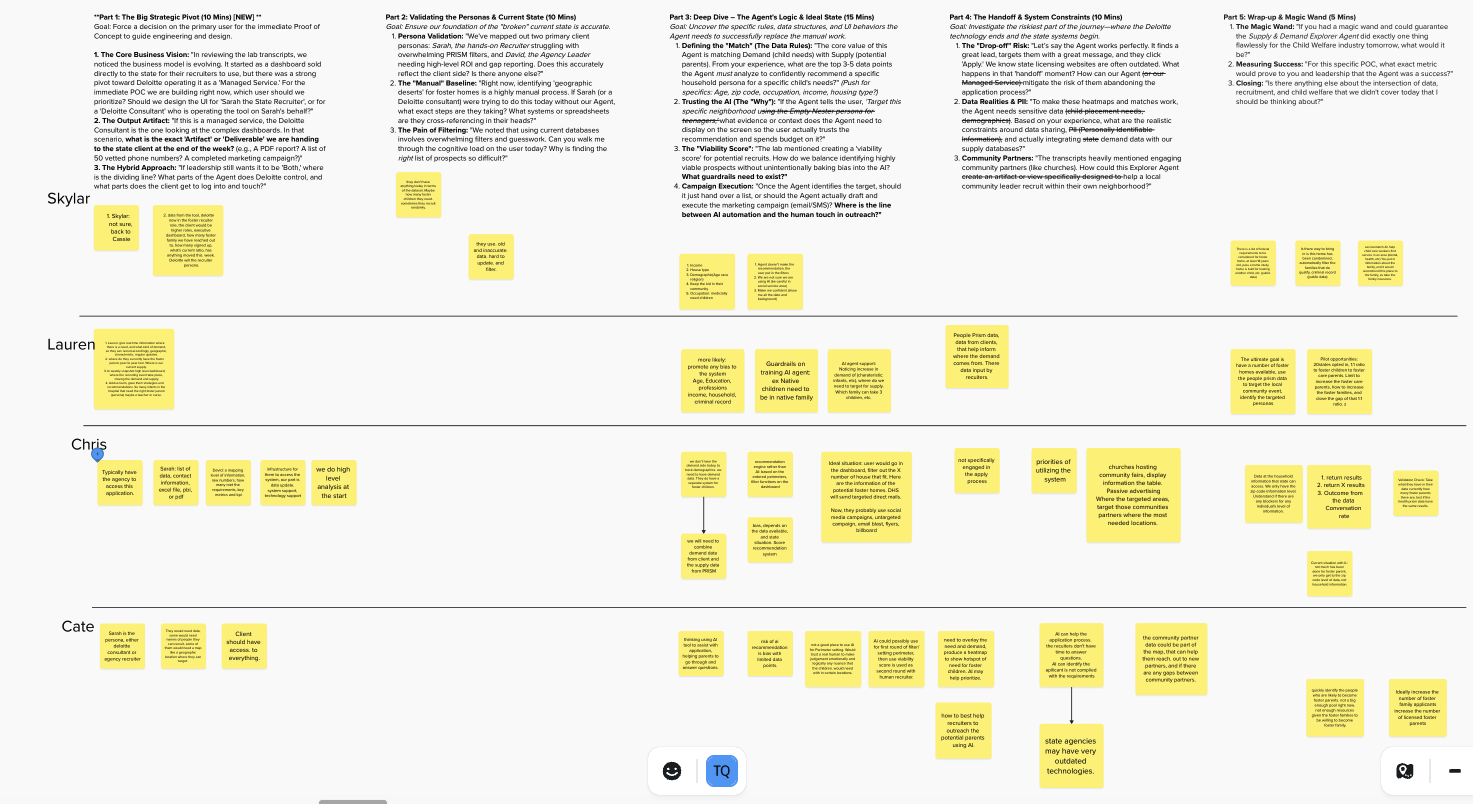
Sarah is the frontline worker responsible for finding foster homes. She works across state or county geography with limited data and tools, often relying on spreadsheets or outdated databases. Technology maturity varies drastically by state and county. Her core tasks are identifying geographic hotspots, applying filters to surface qualified prospects, coordinating outreach across direct mail, email, community events, and church partnerships, and logging campaign results. In managed service mode, a Deloitte practitioner fills the Sarah role — the state agency receives curated output artifacts rather than direct tool access. Her current-state pain: no demand data to overlay, no way to recruit with precision, old inaccurate data that’s hard to update and filter.
David is a strategic leader consuming high-level outputs. He’s accountable for the overall gap between children in care and available licensed foster homes, and needs to make resource and budget decisions. His core tasks are tracking ratio progress against the federal 1:1 target, reviewing campaign performance at a bi-weekly cadence, making channel and geography budget decisions, and communicating ROI to leadership. His current-state pain: zero visibility into campaign effectiveness, manual email-based reporting from the team, no clarity on which channels and personas convert. Workers are burning out making decisions under stress.
 Mural board — persona work from the Industry Lab and Gemini synthesis
Four blockers validated across every session. These weren’t friction points — they were the difference between a recruitment program and a guessing game. Every SME confirmed all four independently.
No demand-side data to overlay supply. Recruiters cannot see where foster homes are needed most. They recruit randomly — broad campaigns in no particular location. There is no mechanism to overlay child placement need with available foster home supply geographically. As one SME said: “They don’t have anything today in terms of the dataset. Sometimes they recruit randomly.” The result: campaigns that miss the hotspots entirely.
No persona-driven targeting. The current approach is broad social media campaigns, email blasts, and billboards. But specific child needs — infants, children with autism, medically complex cases, sibling groups of five, Native American children requiring ICWA-compliant placements — each require a distinct family profile. A teacher or nurse is more likely to care for a medically complex child. An empty nester aged 45–60 has more availability. Without data-driven personas, campaigns cannot match this nuance.
No channel attribution or outreach effectiveness data. Nobody knows whether Facebook ads, direct mail, community events, church-based outreach, or SMS performs best for a given prospect segment. Without channel attribution, every campaign dollar is a guess. Multiple SMEs flagged the need for behavioral segmentation data tied to preferred contact method by persona group — but none exists today.
Data is stale, siloed, and incompatible. Current prospect data is old, inaccurate, and hard to update and filter. Demand data (children needing homes) lives in the state child welfare system. Supply data (potential foster families) lives in People Prism. They are never combined. Technology maturity varies so dramatically by county that some states have no infrastructure to even support the tool.
The most important insight: the problem wasn’t a lack of data. It was a lack of any mechanism to combine two data sets that had never been connected — child placement need and available foster family supply. That single gap explained every downstream failure.
Given data availability, sprint constraints, and the goal of a compelling pre-sales prototype, I recommended three features in prioritized order — each mapping to a validated, high-frequency pain point and a specific moment in Sarah’s journey.
The gap map overlays child placement demand hotspots on foster home supply at ZIP or county level. Recruiters can filter by child characteristic type — medically complex, infants, sibling groups, ICWA — and view existing foster parent locations for peer-to-peer outreach targeting. It also surfaces community partner gaps (churches, schools) geographically. This was the most-cited missing capability in every interview and the lab. Without demand data, all downstream targeting is a guess — and this feature is technically feasible with existing Prism data plus client-provided, de-identified supply data bounded at the ZIP level.
The prospect filter lets a recruiter enter placement parameters — child age, need type, geography — and receive a filtered prospect list with auto-applied public data exclusions. The export includes name, address, phone, email, and preferred channel, with channel-effectiveness signal per persona segment. This directly replaces the most painful manual task (Excel combing), enables the managed service model, and builds in bias guardrails by framing all results as “more likely” indicators — never prescriptive scores. The human recruiter sets parameters and retains all final judgment.
The snapshot dashboard gives David the visibility he has never had: current ratio of children in care vs. available homes vs. the federal 1:1 target, a campaign funnel view from outreach through application and licensing, new foster homes added over time, and an exportable stakeholder report in a shareable bi-weekly format. This solves David’s zero-visibility problem, makes the tool valuable at the leadership tier, and helps the buyer see ROI — accelerating sales conversion. It builds on the demand data infrastructure from Feature 1 and is positioned as a bi-weekly snapshot for the POC, with real-time as a roadmap item.
All persona filters must surface candidates as “more likely to be a fit” — never as prescriptive requirements or exclusionary rules. The child welfare system has documented structural biases, and the tool must not amplify them. ICWA mandates that Native American children must be matched with Native-identifying households where possible — the tool must surface this capability explicitly. No standalone race, religion, or marital status filtering. The human recruiter retains final judgment on every placement. The AI surfaces options; it does not make the recommendation.
All demand-side data (children in care, placement needs) must be de-identified at ZIP code or county level only — never individual or household. Foster parent prospect contact data is PII and must be handled per applicable state data agreements. Social media profile data is available in aggregate behavioral segments, not individual-level profiles. Criminal record data is public but treated as a filter exclusion only — not a scored signal in any machine learning component.
The tool stops at application — the licensing process is a separate, state-administered system. Out-of-state recruitment is not supported: the legal complexity and process overhead make it impractical with no real ROI. Campaign cost and conversion analytics are a roadmap item, not POC scope.
“We would not want to unintentionally further promote biases that already exist in the child welfare system. It’s constantly something the field is trying to undo.” — Lauren Behsudi, Child Welfare Policy SME
Two AI models aren’t redundant — they’re a cross-referencing system.
I came into this project having missed the original 8-hour Industry Advantage Lab, picking up work from a colleague without the lived context of being in the room. Re-watching or re-reading 8 hours of session material to verify what was said and what mattered simply isn’t feasible. Using both Gemini and Claude gave me something better: two independent models synthesizing the same source material, so I could compare their outputs, surface discrepancies, and validate details I couldn’t personally verify. When both models pointed to the same themes, I could trust them. When they diverged, that divergence was itself a signal worth investigating. Two AI tools used sequentially isn’t inefficiency — it’s triangulation.
Mural is a thinking space and a collaboration space — both at once.
I used it in two distinct modes throughout this project, and the combination was what made it powerful. As a thinking space: transferring the Gemini-generated personas and journey map into Mural forced me to interrogate them visually. Seeing them spatially — next to the raw lab sticky notes — immediately revealed what was underdeveloped and what gaps the follow-up interviews needed to close. As a collaboration space: when the cross-team affinity mapping session happened, everything was already organized and shareable. The thinking work I’d done in Mural became the raw material for the team conversation.
Affinity mapping across five labs found what one lab’s AI synthesis couldn’t.
I was responsible for one of five Industry Labs running in parallel — each focused on a different domain, each generating its own SME insights. After Claude synthesized my child welfare findings, I had strong signal within my cohort. But I couldn’t know whether those priorities were specific to child welfare or shared problems the PRISM product needed to solve across the board. The cross-team session brought all five lab teams together to compare findings. When pain points converged independently across multiple labs, they moved to the top of the PRISM priority list. That’s a level of validation no single AI synthesis could have produced on its own.
Hearing human hesitation directly made the ethical constraints real — not theoretical.
I expected the SME follow-up interviews to fill in gaps in the journey map. I didn’t expect them to fundamentally shift how I understood the role of AI in this product. What surprised me was how visibly uncomfortable the experts became when I asked about AI-driven recommendations in child welfare. Their hesitation wasn’t about technology literacy — it was about the history of bias in the system, the weight of what a wrong recommendation would mean for a child, and a deeply human resistance to delegating that judgment to an algorithm. Reading a synthesized summary of that concern is one thing. Hearing it directly made it the moral core of the product design, not just a guardrail.
What I would do differently: involve the actual frontline recruiter (Sarah) much earlier.
The SMEs in the lab were mostly Deloitte practitioners and policy leads — not the frontline state recruiter we were ultimately designing for. I validated the Sarah persona from proxy perspectives, and AI synthesis gave me a coherent picture. But a direct contextual inquiry with an actual state recruiter would have surfaced the technology gap between states far more concretely. That gap has real implications for onboarding, training, and interface simplicity that the current POC spec doesn’t fully address. This is the next research sprint I would run.
“It’s not a good place to use AI for parameter setting. I would trust a real human to make judgment — emotionally and logically — about any nuance that a child would need.”