PW AOG Management
From a $52M reserve managed in disconnected spreadsheets to a unified enterprise allocation platform — in 6 weeks.
A $52 million reserve managed by human middleware.
“Responsible for managing a $52M reserve, yet I spend half my week as a data janitor manually merging spreadsheets; by the time I’ve reconciled the shop floor with the official forecast, the data is already four days old.”
— FMT Process Manager, Pratt & Whitney
System disconnection. FMT, FCOE, and DOME don’t communicate. Users manually merge 3–5 separate exports every reporting cycle, creating multiple versions of truth that require constant verification.
Manual data processing. High-level managers spend 30–50% of their week on basic data cleaning. DOME reconciliation alone can consume a full team-day to manually check 56+ airline operators.
“Eyeball” optimization. Engine slot decisions affecting millions of dollars are made without fleet-wide impact visuals. Scenario planning across multiple Excel files is too cumbersome for proactive planning.
4–5 day cycle time. By the time a report reaches accounting, the underlying shop data has aged to the point where decisions are made in the rearview mirror — reactive, not proactive.
Traditional design thinking, accelerated by AI. A 6-week sprint from discovery to functional prototype — combining rigorous research methodology with AI tooling to compress timelines without cutting corners.
Stakeholder Interviews & Workflow Mapping
Conducted in-depth interviews with the primary persona — an FMT Process / Customer Programs Manager — to understand the 9-stage manual workflow in detail. Mapped every tool, handoff, time cost, and emotional state across the current process.
Research Synthesis & Insight Clustering
Synthesized interview data into a research report identifying three core pain point clusters: System Disconnection, Manual Data Latency, and “Eyeball” Optimization. Defined the persona’s desired outcomes as three actionable “Jobs to be Done” — Optimize, Report, and Simulate.
Solution Architecture & Prompt Engineering
Translated research insights into a future-state architecture: a unified Forecasting & Allocation Hub replacing the 9-step manual process with 4 integrated workflows. Wrote structured prompts encoding the user flows, data schema, and visual requirements for AI-assisted prototyping.
Rapid Concept Generation with Figma Make + Claude
Used AI-powered prototyping (Figma Make) to rapidly generate working UI concepts from research-grounded prompts. Iterated on three views — Dashboard, Scenario Planning, and Report — producing high-fidelity interactive prototypes that would have taken weeks to build manually.
Client Presentation & Next Steps Definition
Presented the full research synthesis and interactive prototype to design leadership and client stakeholders. Demonstrated how AI tooling compressed the ideation-to-prototype cycle while keeping the design grounded in real user research. Defined a phased technical roadmap for engineering handoff.
What the interviews revealed.
50% of time lost to data janitoring. The primary persona spends up to half their working week simply filtering, cleaning, and merging datasets — not on the strategic analysis their role demands.
4–5 day full cycle time per report. The end-to-end process from forecast trigger to final report spans nearly a full work week — meaning decisions are always made on stale data.
$5M potential savings per optimization. Interviewees estimated that a single well-optimized induction slot reallocation can save approximately $5 million in AOG support costs.
4+ disconnected systems per workflow. FMT, FCOE, DOME, Excel, and LoB Tool — users act as “human middleware” stitching together data from 4–5 separate platforms every cycle.
56 airline operators to manage. DOME reconciliation requires a team of analysts to manually check readiness status for 56+ operators — a process ripe for automation and visualization.
3 core jobs to be done. Three clear use cases emerged: Optimize (right engine, right place), Report (accurate AOG penalty accounting), and Simulate (what-if scenario planning).
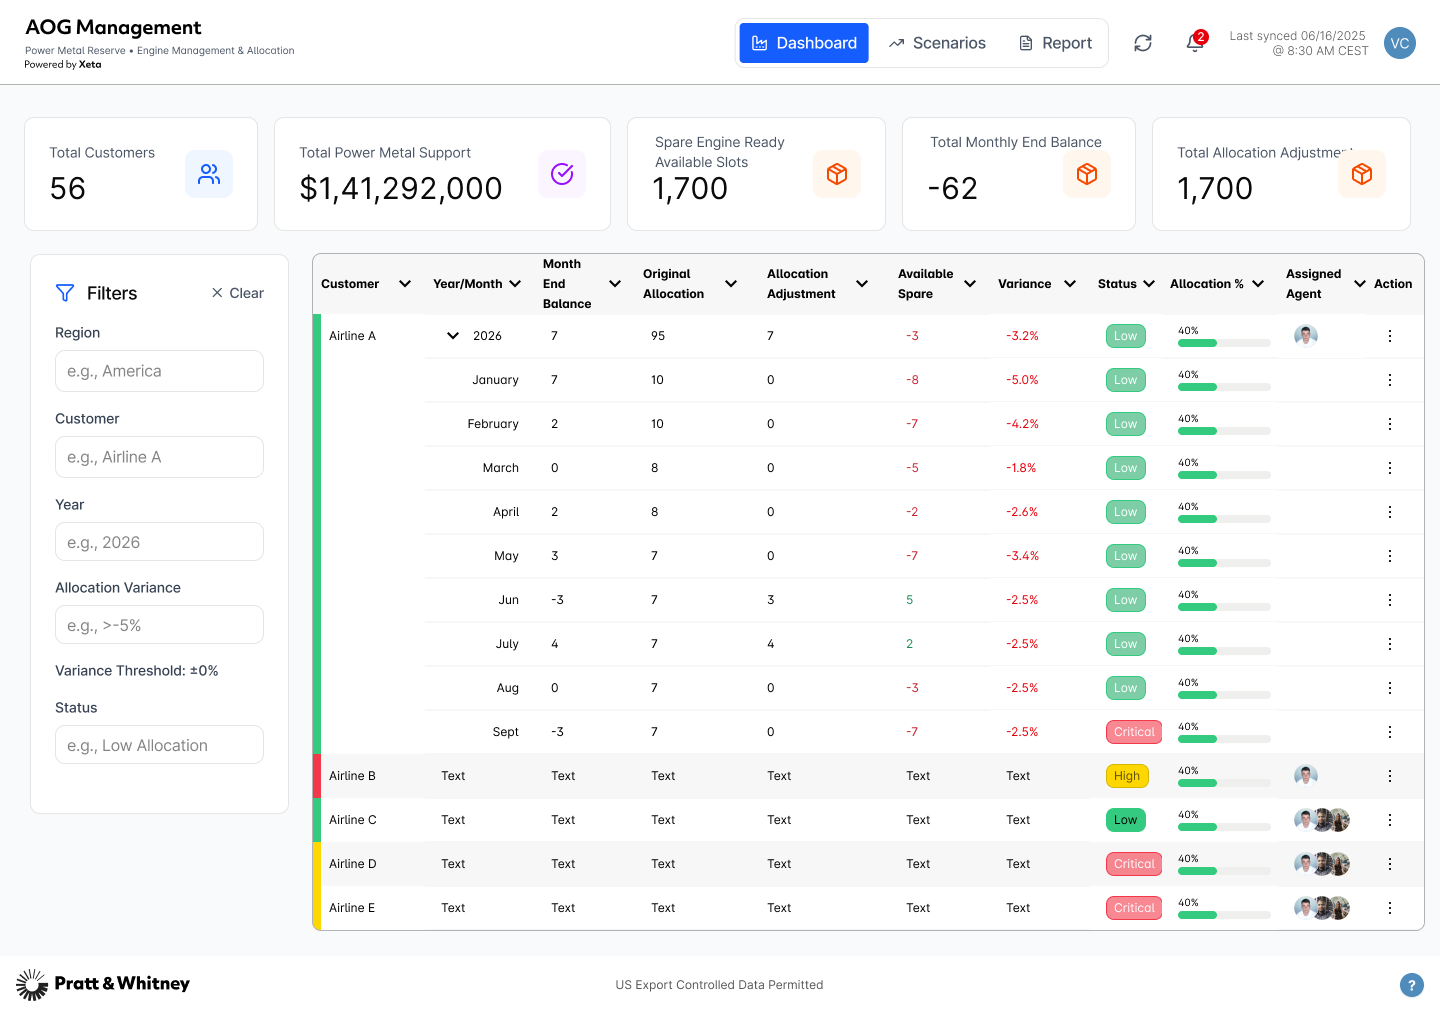
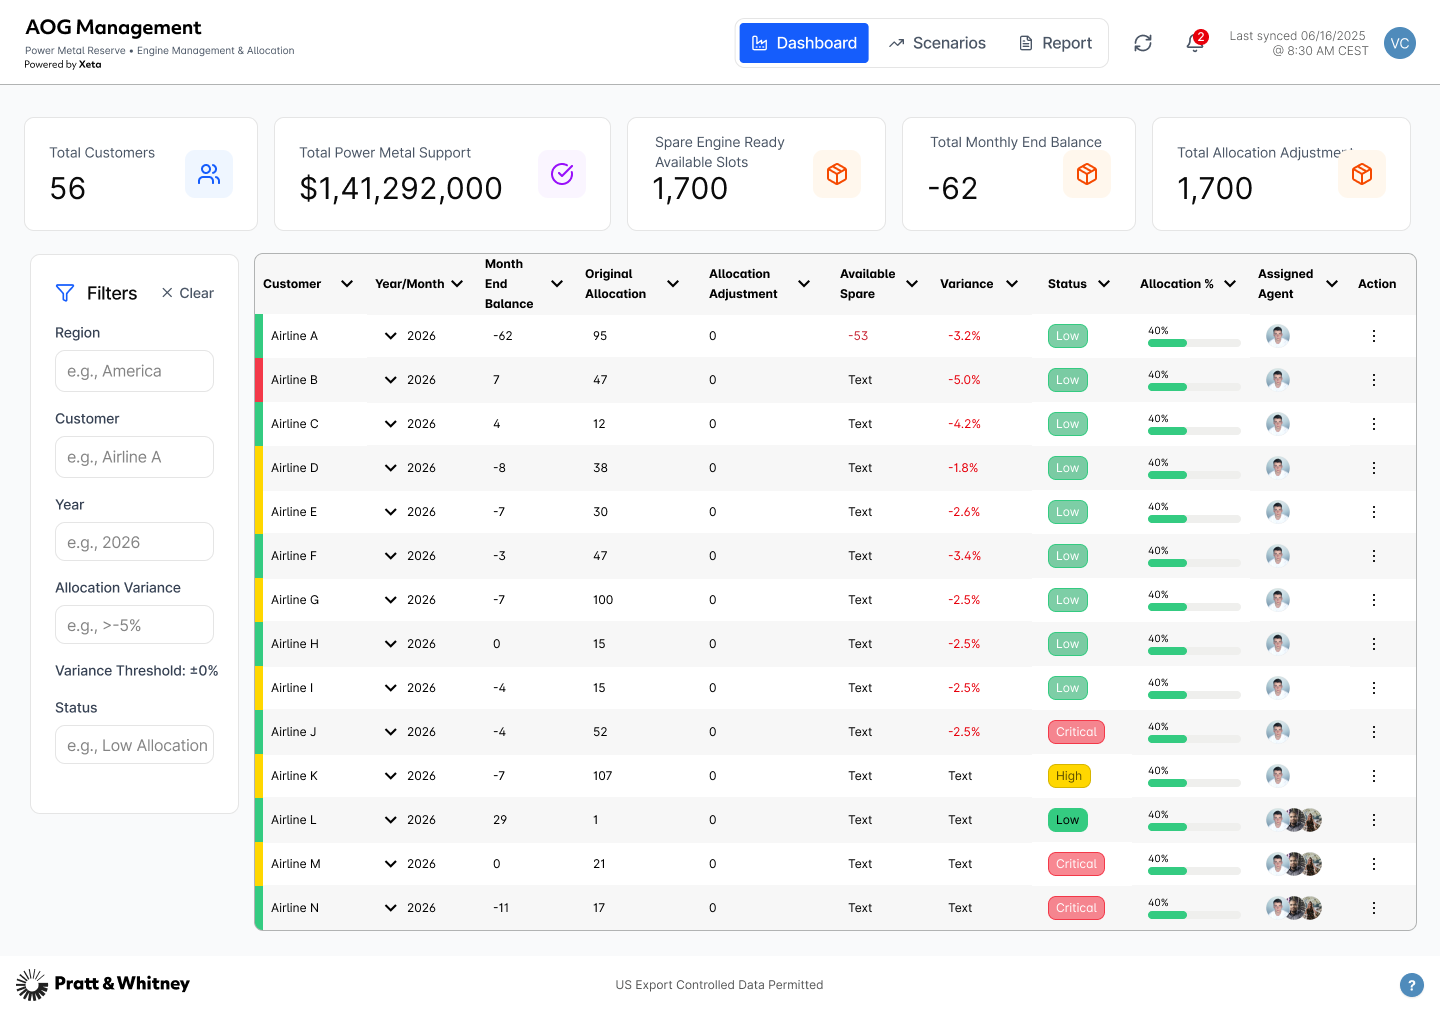
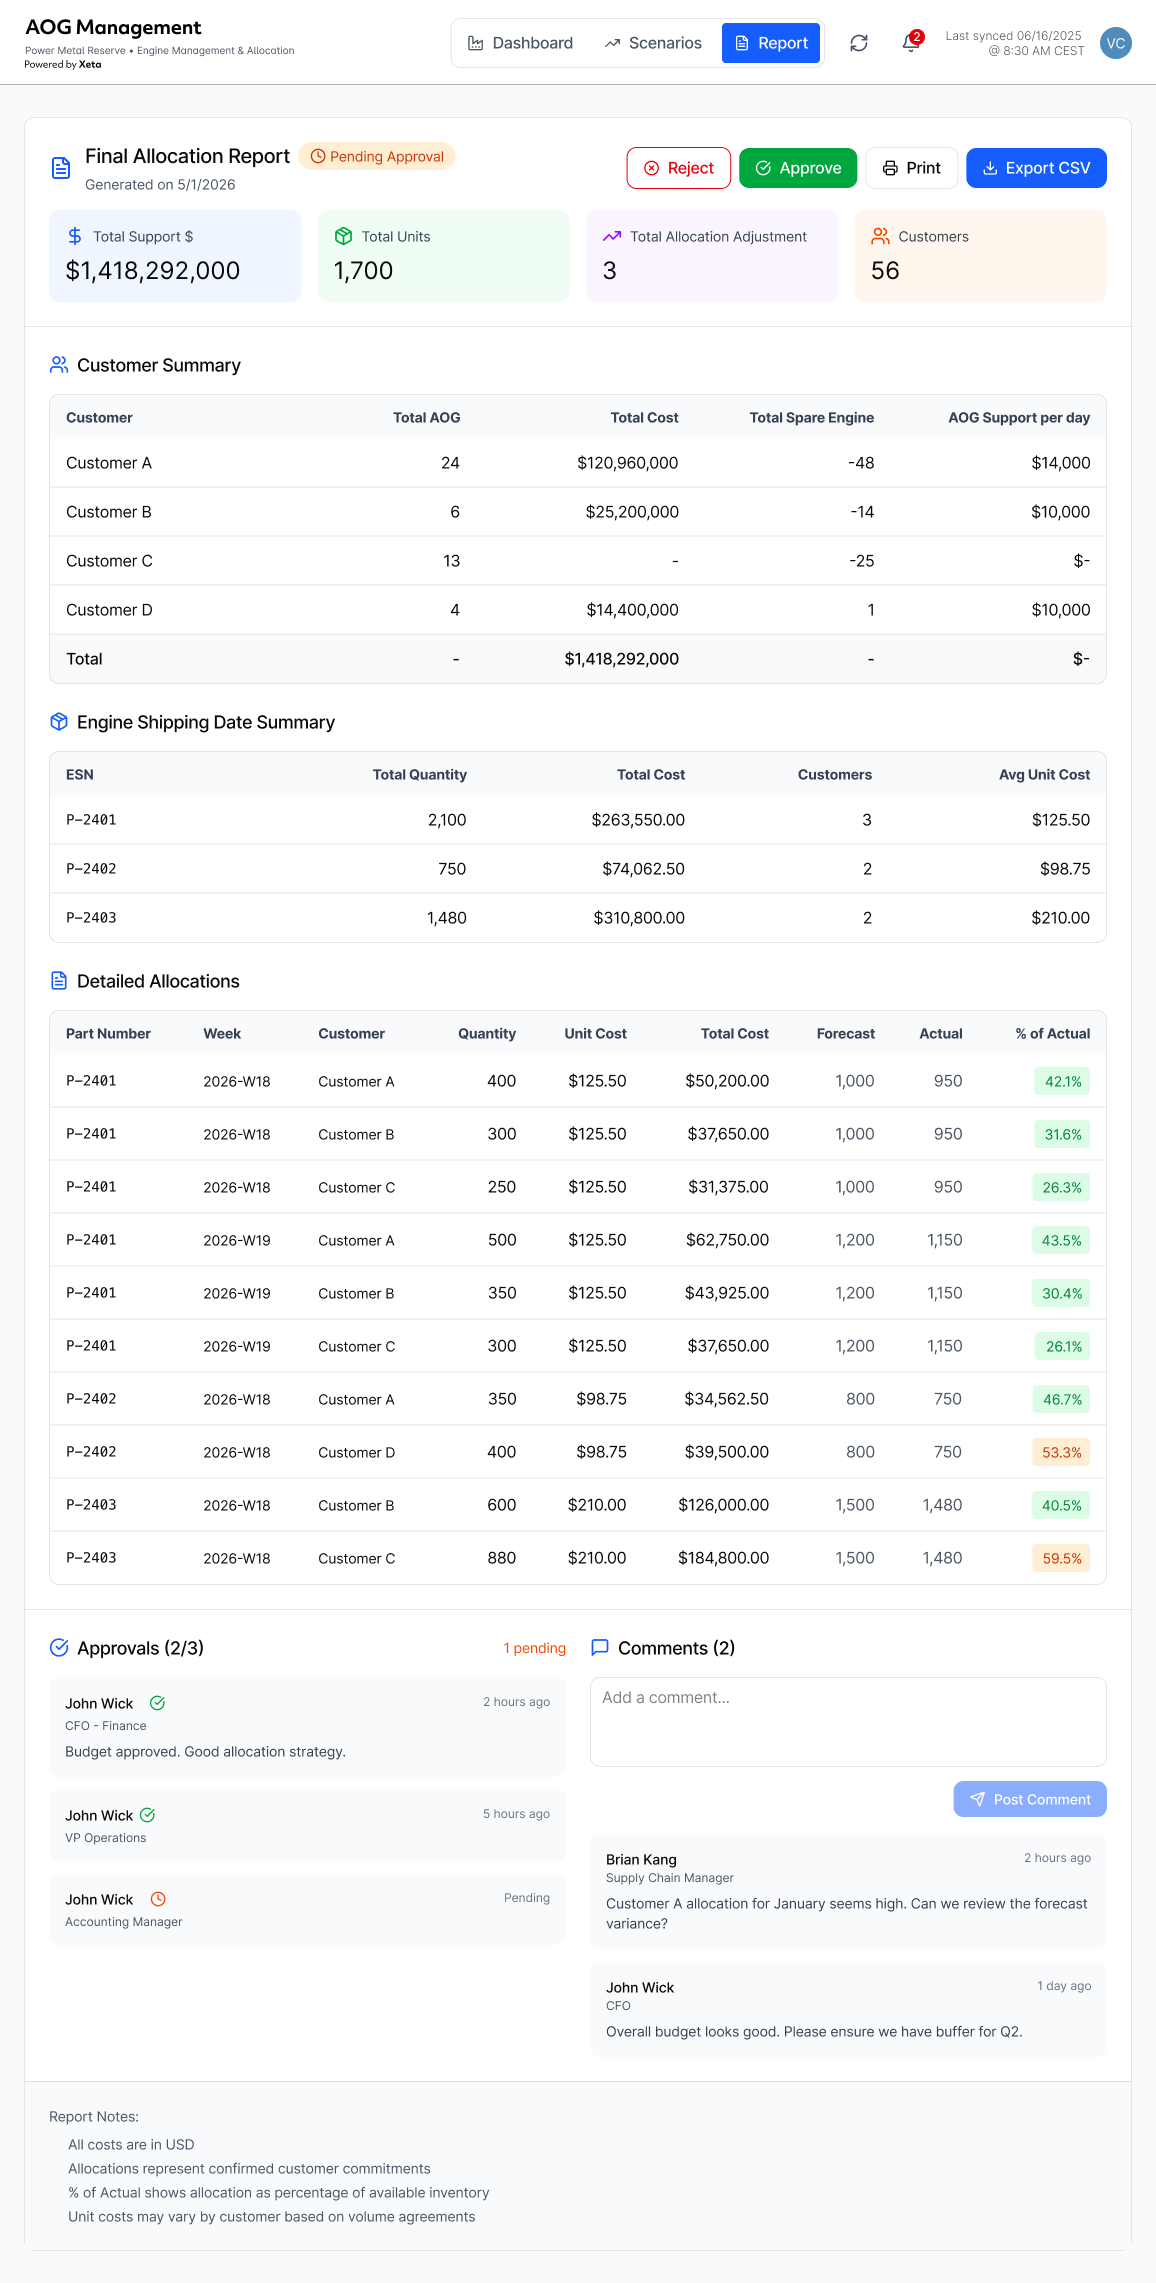
A unified Forecasting & Allocation Hub. Three integrated views replacing the 9-step, multi-platform manual process — designed around the three Jobs to be Done uncovered in research.
Real-time view of all 56 airline operators with inline editing, status indicators, and contextual filters. Replaces the manual DOME reconciliation and Excel merging steps.
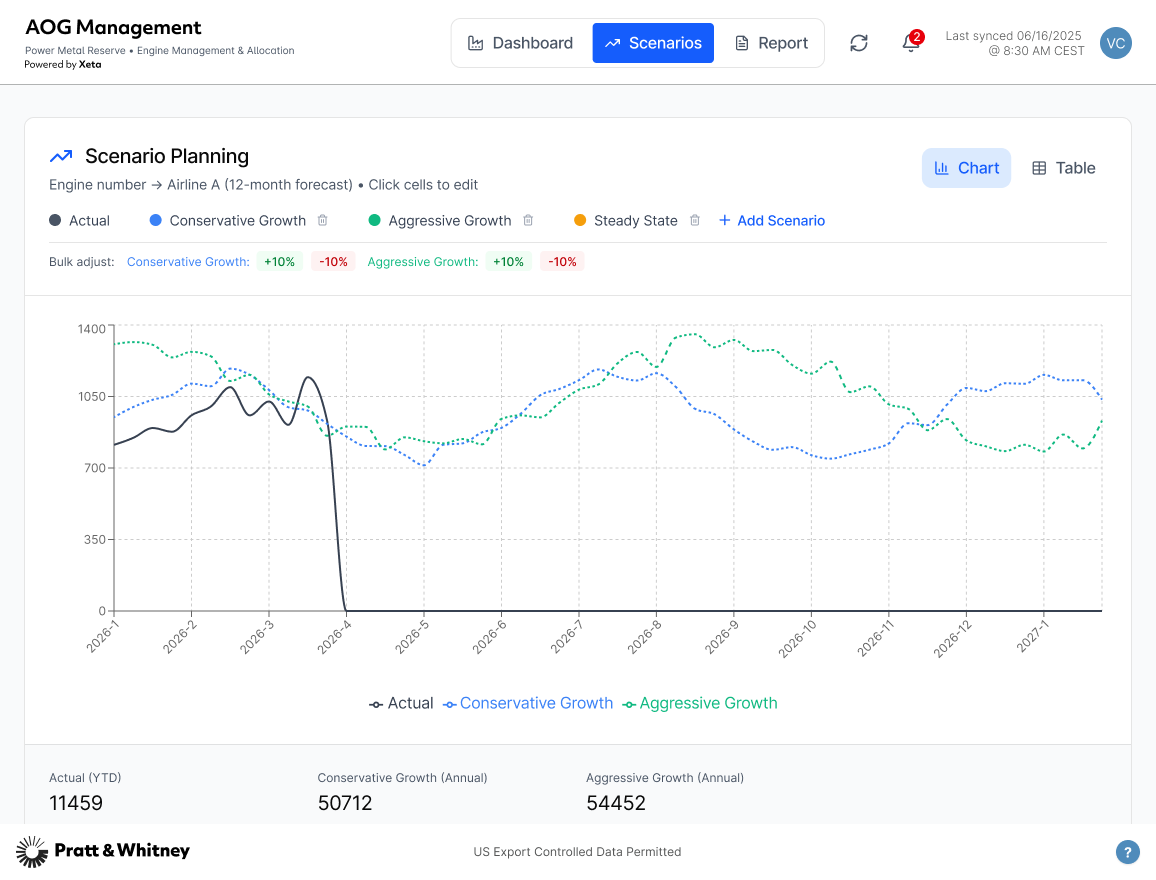
12-month forecast visualization with Conservative, Aggressive, and custom growth scenarios. Bulk ±10% adjustments replace the LoB Power BI + Excel workflow.
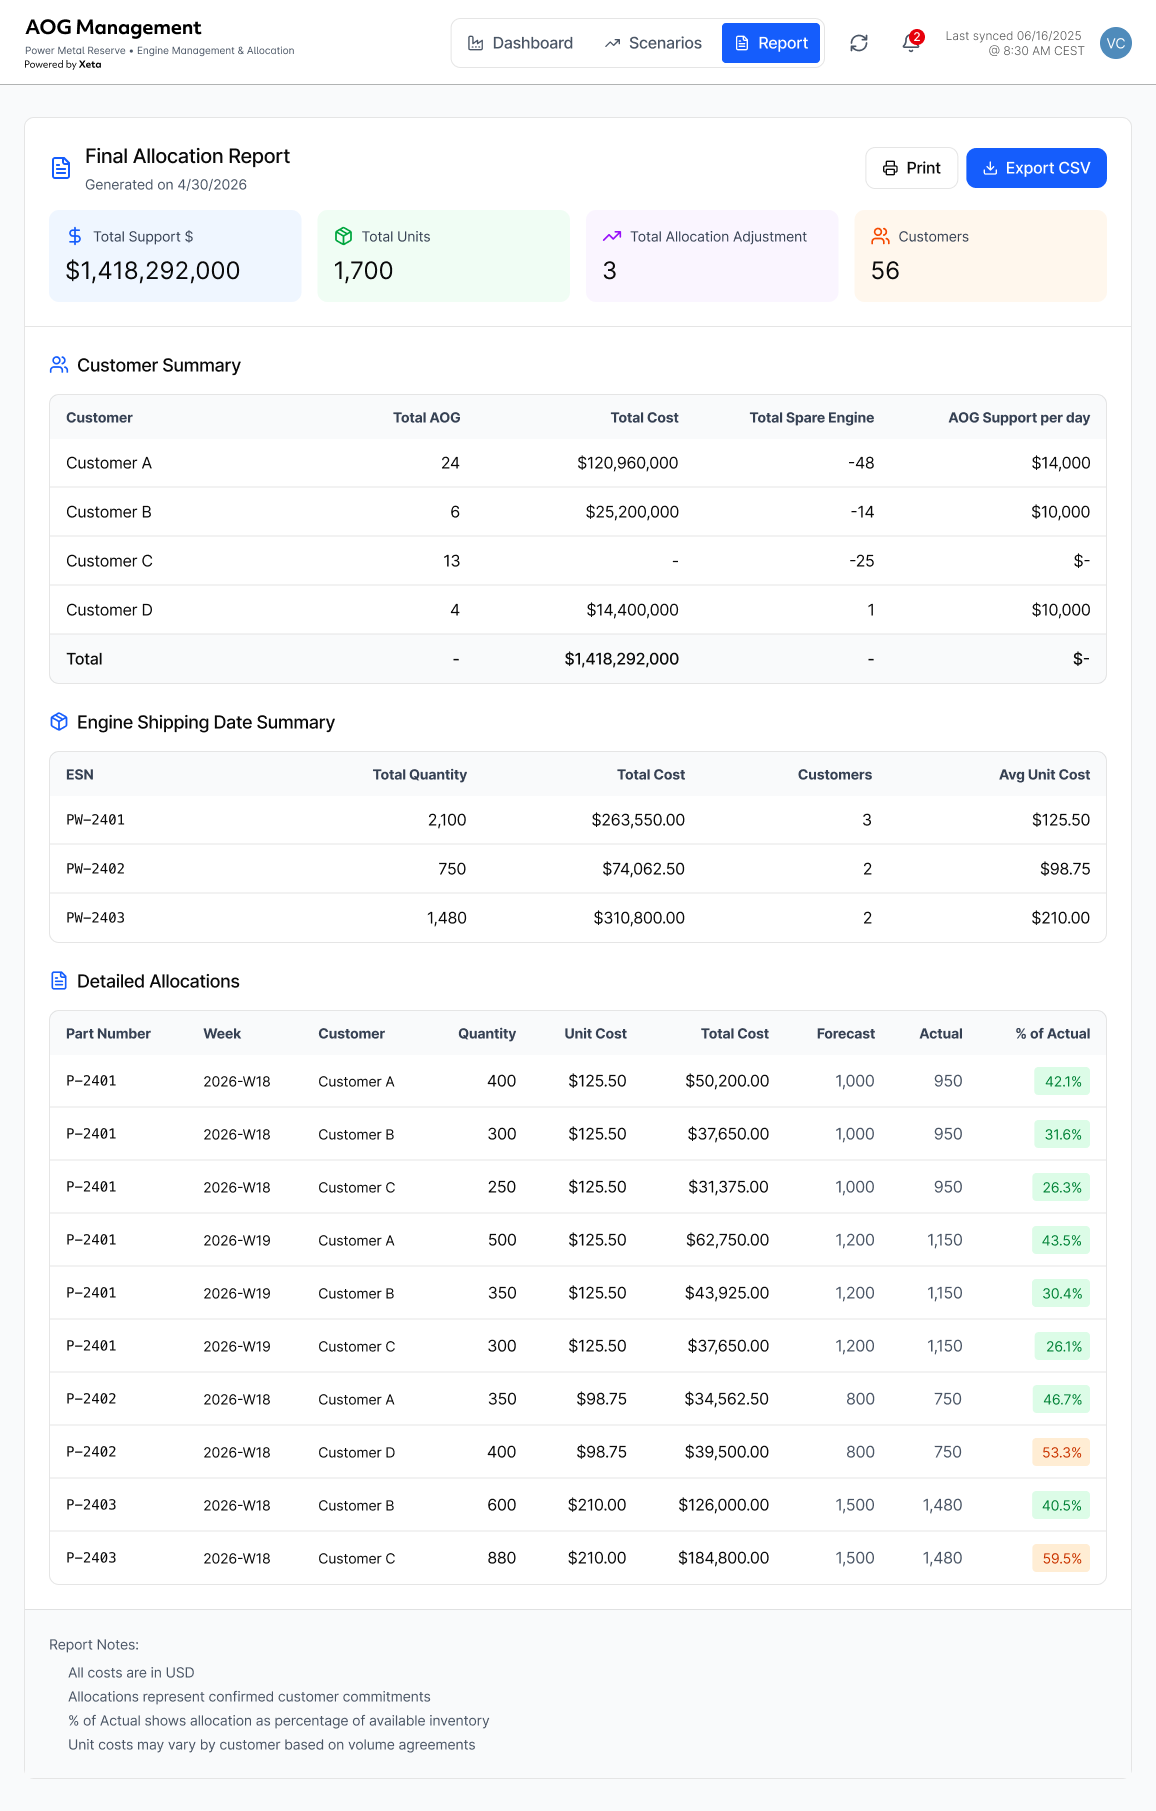
Auto-generated allocation report with approval workflow, stakeholder commenting, and one-click CSV export — eliminating the manual “AV to PH” Excel compilation.
Real-time sync timestamp, notification badges, and inline commenting thread — replacing the email/Teams handoffs between analysts, accountants, and fleet managers.
Three views, one source of truth. Interactive prototypes generated with Figma Make from research-grounded prompts — each screen maps directly to a Job to be Done.
Research → Prompt → Prototype in days, not weeks. The key was treating AI as an execution accelerator, not a replacement for thinking. Research findings were translated into precise prompts — so the AI built the right thing, not just something.
The design process remained fully researcher-led: every prompt was written to encode specific user needs, data structures, and interaction patterns discovered through fieldwork. AI compressed weeks of implementation into days.
User Interviews
In-depth sessions with FMT Process Managers to map real workflows, pain points, and desired outcomes.
Research Synthesis
Clustered findings into pain point themes, persona needs, and Jobs to be Done. Defined the future-state architecture.
Prompt Engineering
Translated user flows, data schema, and visual requirements into structured prompts encoding all research context.
AI Prototyping
Used Figma Make + Claude to generate functional, React-based prototypes from research-grounded prompts.
Validation
Presented interactive prototypes to stakeholders for feedback. Iterated on real user reactions, not hypothetical critiques.
From reactive reporting to proactive strategy.
Research rigor is what makes AI output credible.
Figma Make generated prototypes quickly, but the quality of what came out was entirely determined by what went in. Grounding every prompt in specific findings — named personas, real frustrations, verbatim workflow steps — meant the output felt like a real solution to a real problem, not a plausible-looking guess. The AI didn’t know what a Parts Manager actually does. The research did.
Speed changes what you can validate.
Compressing synthesis-to-prototype from weeks to days isn’t just faster — it changes what’s possible. Concepts could go back to stakeholders while the research was still fresh, feedback could be incorporated before the team had mentally moved on, and we weren’t defending decisions that had aged past the point of being revisited. The prototype became a working artifact, not a deliverable.
Cross-system visibility is the real product.
The most consistent finding across all three personas was the same: people were spending hours every day reconciling data between systems that should already agree. FMT, FCOE, and DOME exist for different purposes, but the decisions they support are connected. The design work wasn’t really about building screens — it was about making the cost of fragmentation visible, and giving teams one place where that cost disappears.
Bring engineers in before the prototype is done. The prototype moved fast enough that engineering conversations happened after the concept was already formed — and several features that tested well are technically complex in ways that might reshape the design if surfaced earlier. Next time: a lightweight technical feasibility check at synthesis, not after the prototype is already in front of stakeholders.
What I would do differently